While our team collaborated on everything, each of us had a unique role to play. Alongside being a UX designer and researcher, I took on the role of Product Manager, steering the project toward success.
Role as Product Manager: Oversaw the project plan and ensured smooth progress.
Timely Deliverables: Ensured designs and deliverables were submitted on time to the client.
Task Assignment: Assigned tasks based on each teammate's strengths, weaknesses, and interests, fostering efficiency and collaboration.
Deadline Management: Created a detailed project plan and ensured all deadlines were met ahead of schedule.
Client-Centric Approach: Focused on meeting client needs by making feasible, cost-effective, and easily implementable design decisions.
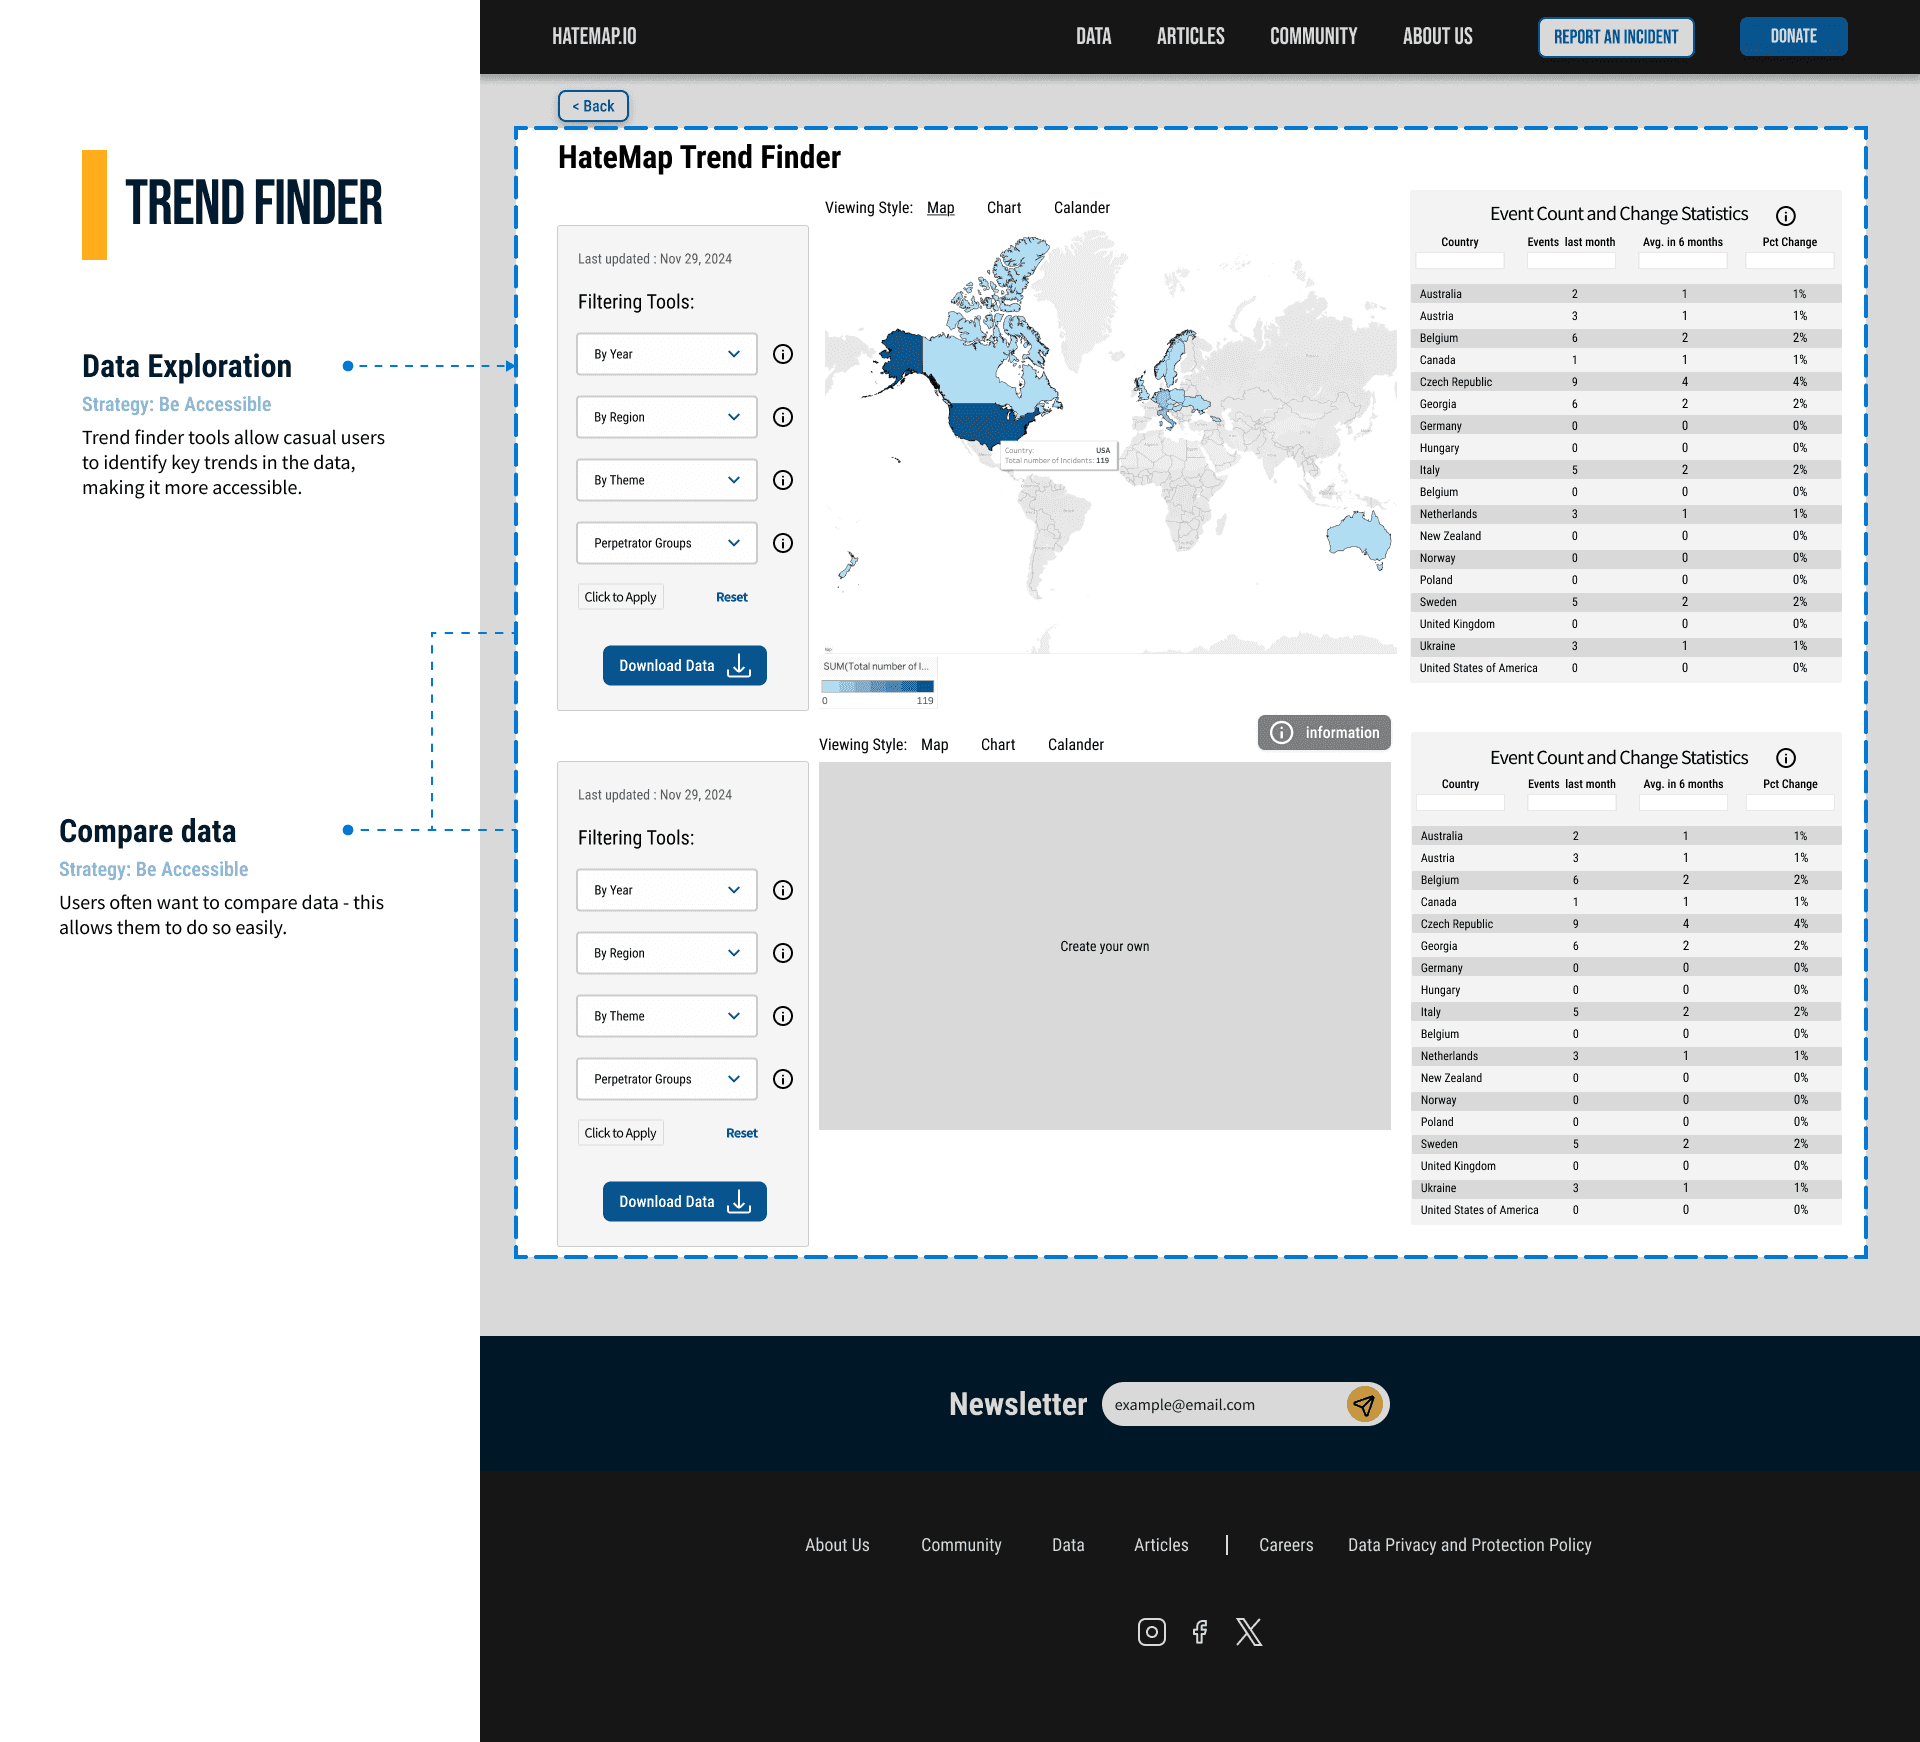
Data Presentation: Led efforts to present data effectively on the website using tools like Tableau and Datawrapper, emphasising key visualisations to align with client goals.
Cost-Effective Solution: Designed a budget-friendly, easy-to-implement website for Hatemap.io, aligning with their non-profit constraints while ensuring functionality and impact.
Simplifying Data for Impact: Without prior data visualisation expertise, we designed a website that transformed complex information into an engaging, user-friendly experience, ensuring 100% accessibility and clarity for all users.
Easy-to-Use Templates for Impactful Storytelling: We designed 9 easy-to-use templates that let the client share information seamlessly with professionals (like researchers and journalists) and the public. These templates will help over 1000+ users connect globally, share stories, and engage, while making it simple for the client to update the website and keep it current—all without needing technical expertise.
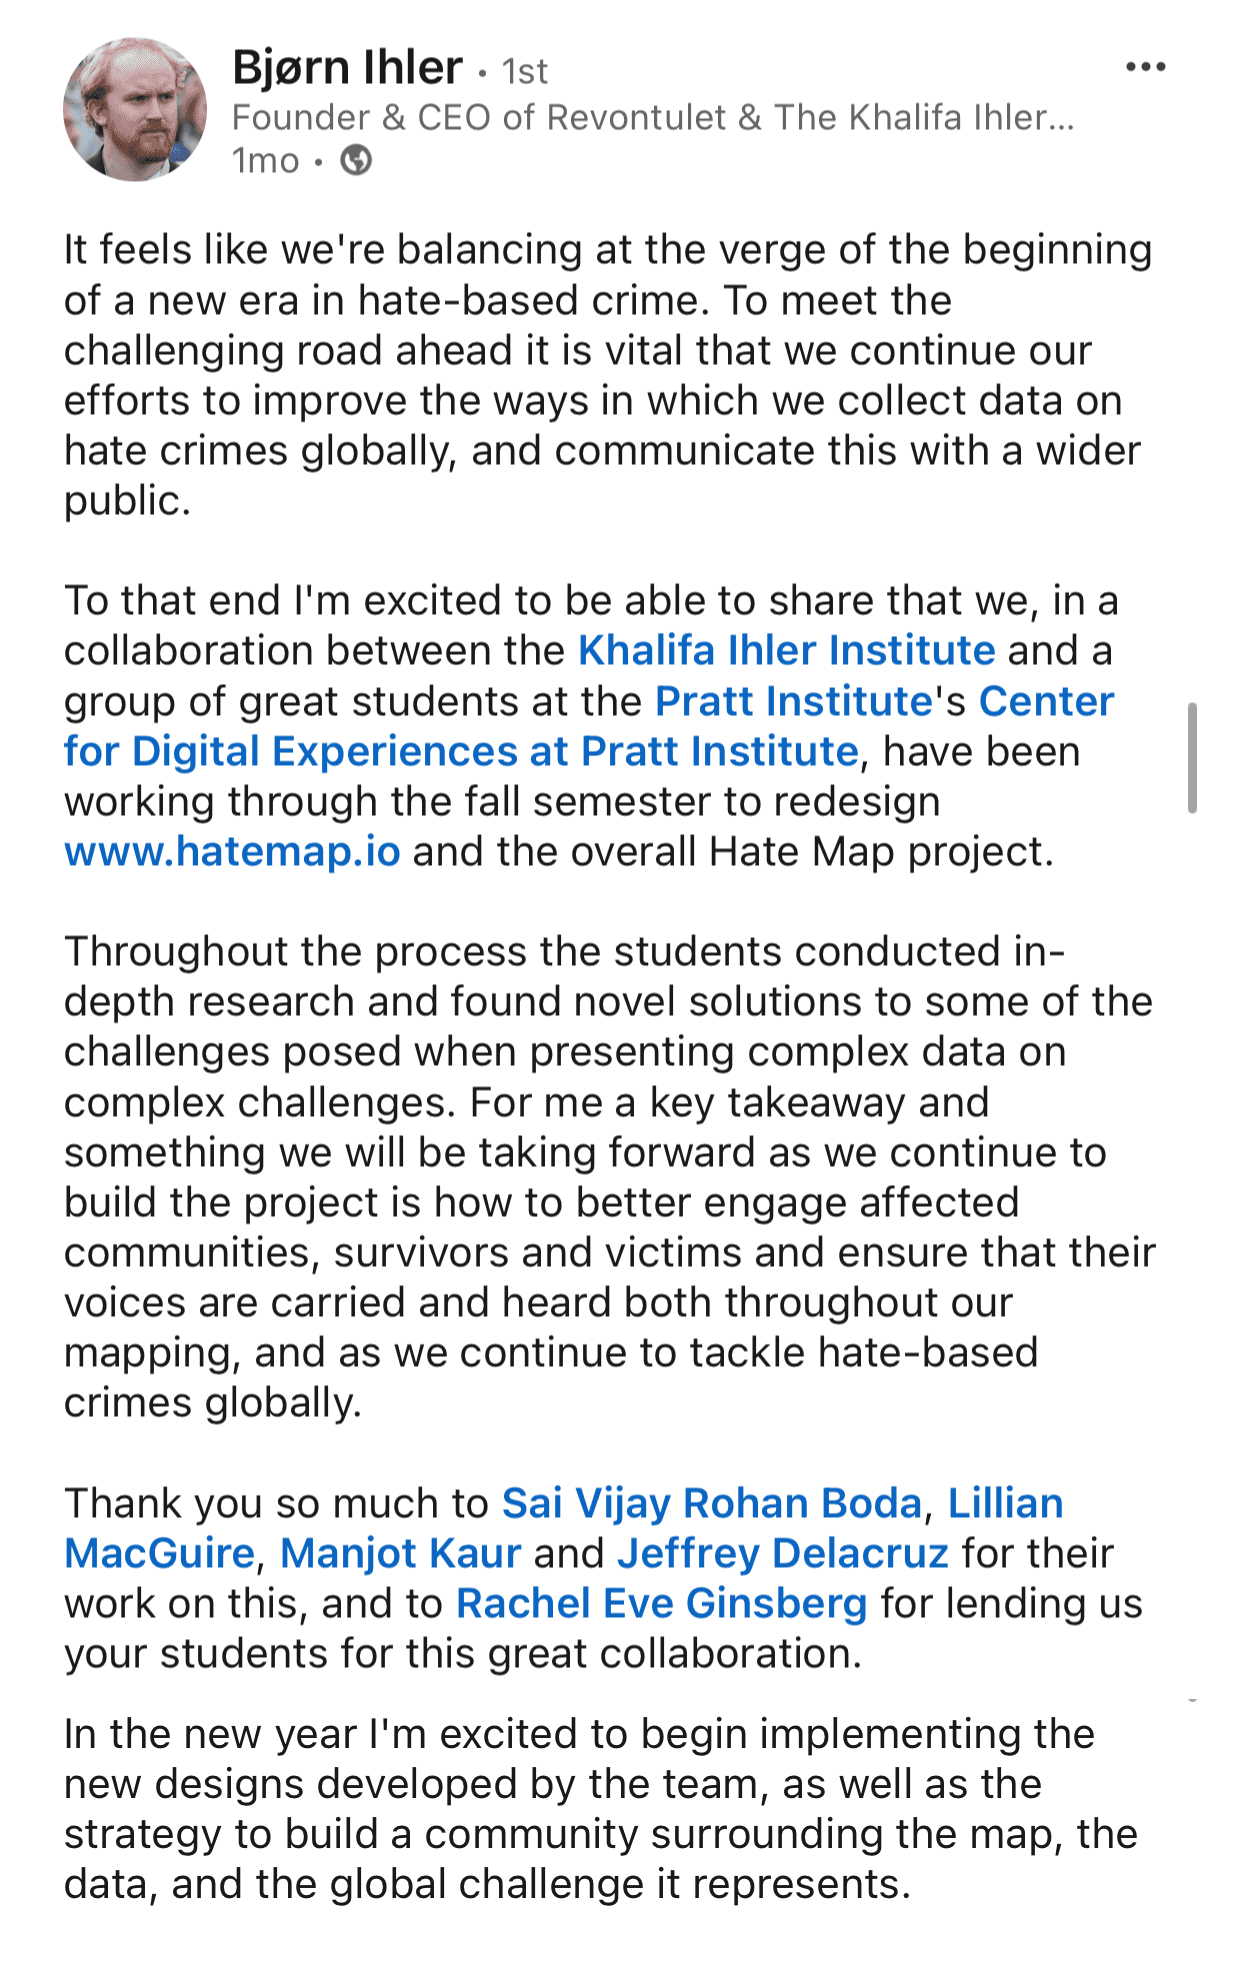
Client Delight & Implementation Ready: Bjørn was thrilled with our Hatemap.io website design, praising our efforts. He plans to implement 100% of our work, ensuring it goes live to empower users and amplify the platform’s impact.
Purpose: Hatemap.io is a website that focuses on 'The Hate Map', an online tool and datasets designed for researchers, activists, and journalists to analyse the global impact of far-right extremism.
Context: Created in response to the rise in far-right terrorist attacks driven by white supremacist ideologies over the past decade.
Unique Focus: Unlike datasets tracking extremist groups or individuals, it monitors incidents ranging from minor actions (e.g., flier campaigns, protests) to severe acts like hate crimes and terrorism.
Scope: Offers a comprehensive view of global, regional, and local threats posed by racially and ethnically motivated extremists, aiding in assessing their activity levels.
Our six-step design process for building an effective website for Hatemap.io:

To align with Bjørn’s vision and truly understand the challenges, we began by evaluating the existing Hatemap.io website.
We asked a critical question: Is the current design effectively serving its purpose?
The answer is clear—NO, it’s not. Here’s why:
Design Critique
We started by analysing and evaluating the existing website:
First Impressions:
Scrolling Down:

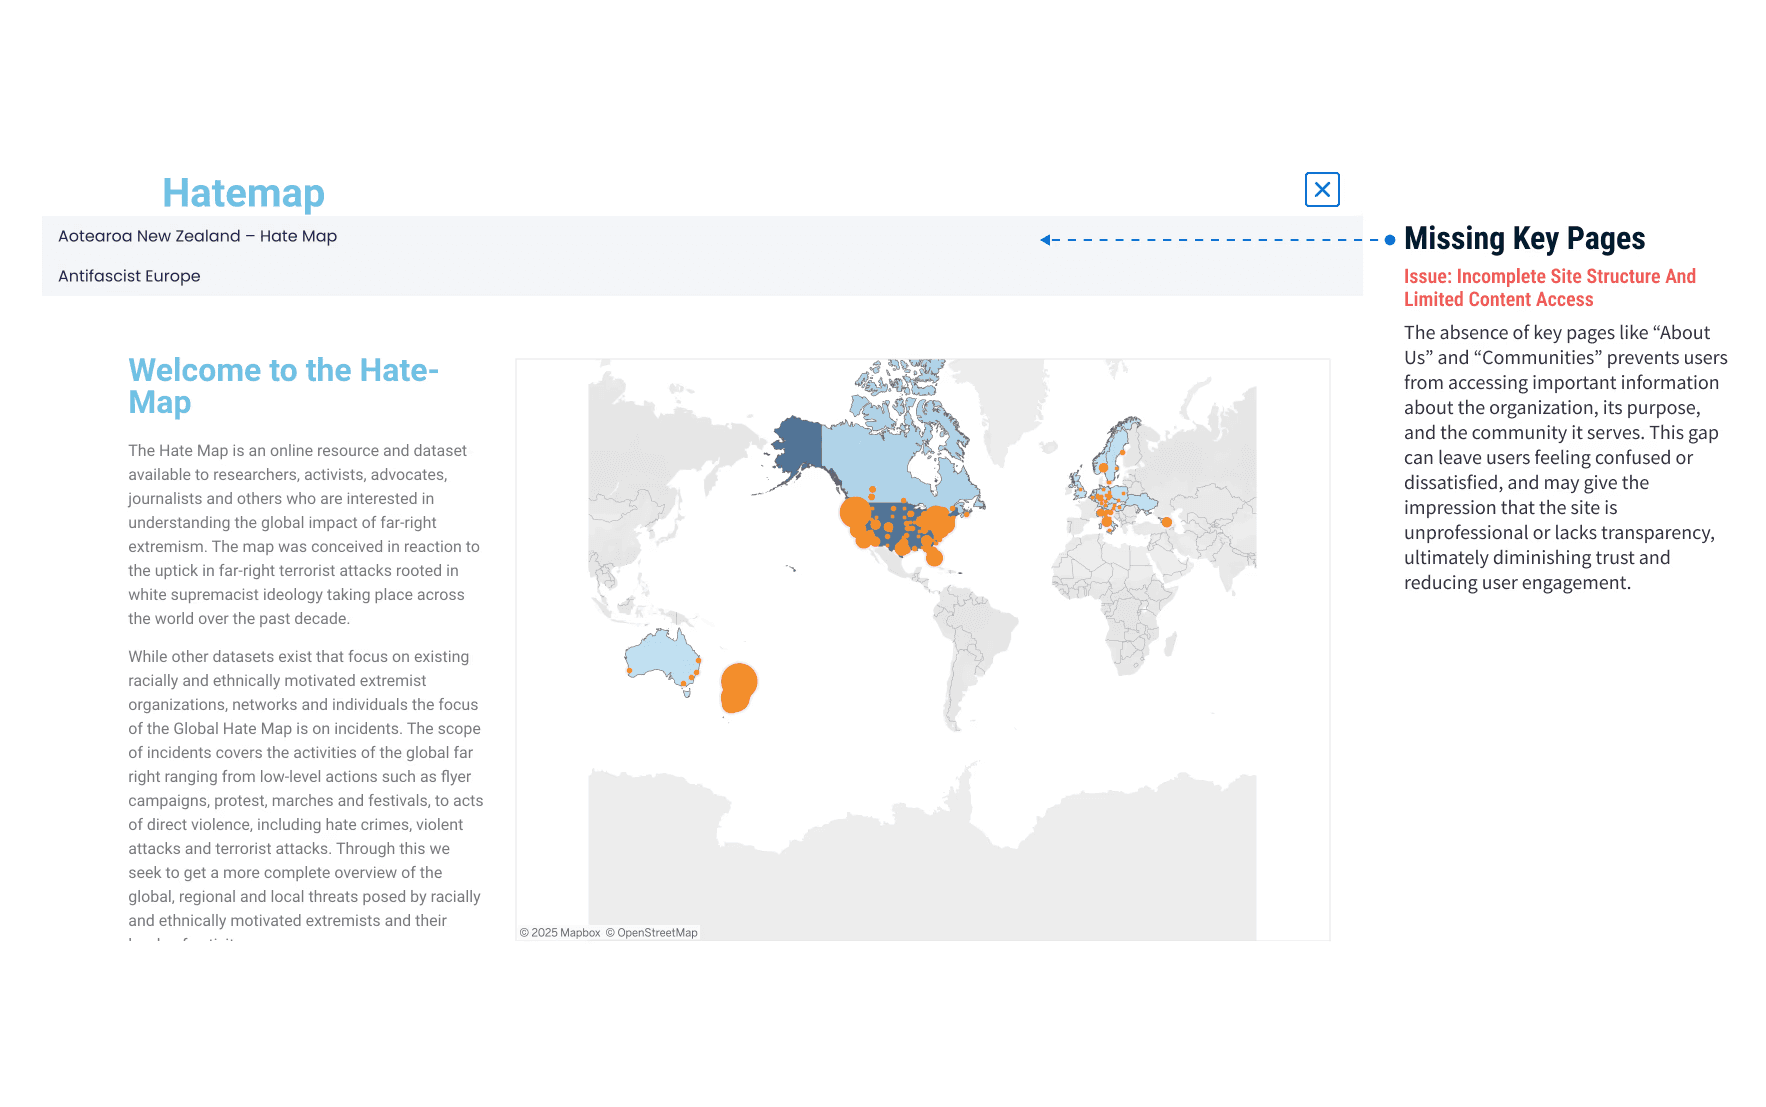
Through a thorough analysis of the current Hatemap.io website, we identified major gaps: a lack of information about the organisation and insufficient context for the data displayed on the map.
Realizing these insights alone weren’t enough to drive meaningful design improvements, we dove deeper into research using the following methods:
Competitive Analysis

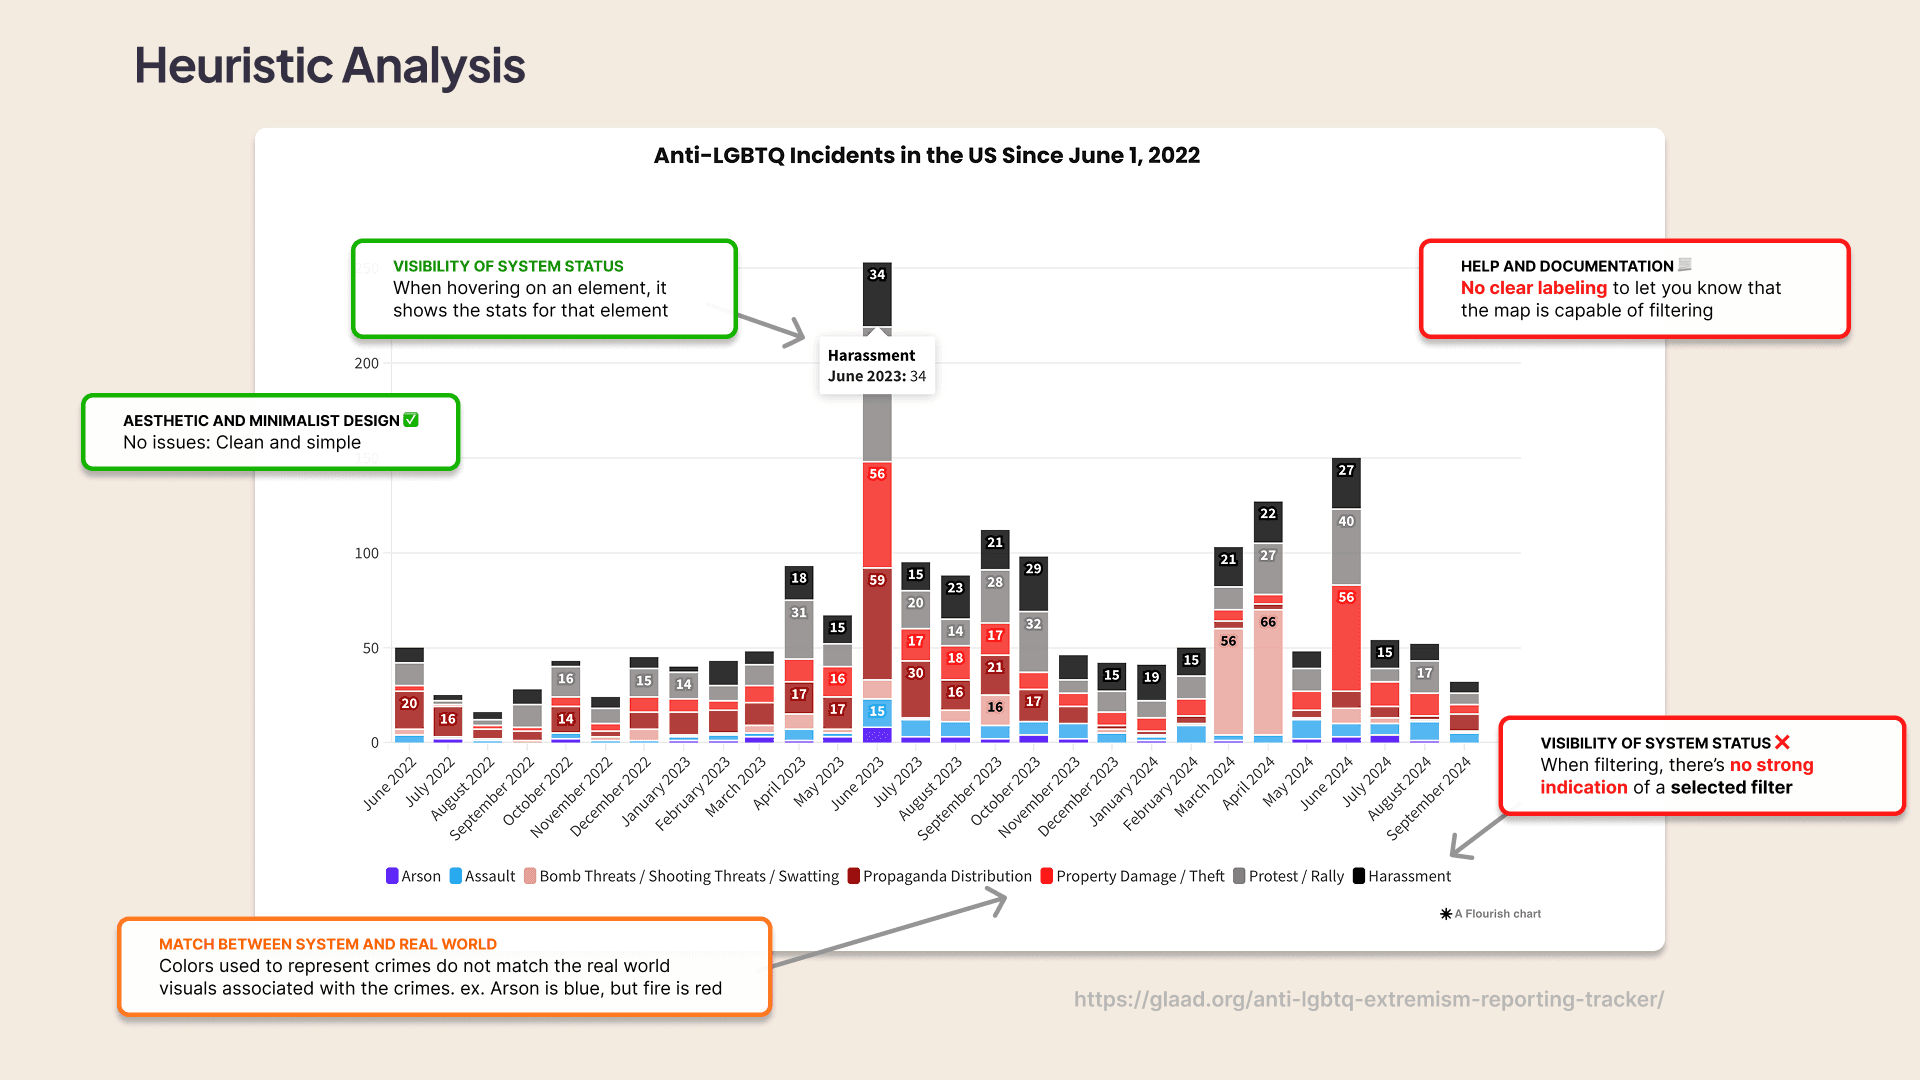
Heuristic Analysis
Using Nielsen Norman’s 10 Usability Heuristics, we evaluated 6 websites: HateMap.io, Khalifia Ihler, NYT Corona Virus World Map, GLAAD.org, AntiLGBTQ incidents in the US, and Institute for Economics and Peace and here's what we found:
Smart Filtering for Accessibility:
Filter buttons are a must—they make navigation easy.
Show selection clearly (e.g., color change) for better usability.
Add labels and explanations to help users understand data and key components.
Cater to All Users:
Design for average, intermediate, and advanced users to grow your site’s user base and ensure everyone finds value.
Literature Review
We explored blogs, articles, and platforms like Bellingcat, Hellgatenyc.com, and Acleddata.com to understand how they structure and present complex information effectively. Here's what we learnt:
Engaging Narratives: Strong storytelling techniques make even text-based formats compelling.Timelines and static visuals simplify complex data and keep users engaged.
Credible & Accessible: Stories use APA citation format, offering credible sources and links for deeper understanding.
Multifaceted Insights: Covers diverse regions, events, and conflict actors, providing a well-rounded view of global complexities.
Moderated Interviews


Clarity and Engagement Through Simplified Data:
Simplify data, boost engagement, and empower users by providing clear labeling, interactive elements, visual hierarchy, and guided tutorials that highlight key insights.
Building Trust Through Inclusive, Transparent Data:
We can foster inclusivity and trust by supporting all expertise levels, offering data tools, using citations, and marking data gaps for transparency.
Fostering Connection for a Thriving Community
Enhance engagement and build a thriving community by fostering seamless communication between the users and the organisation.
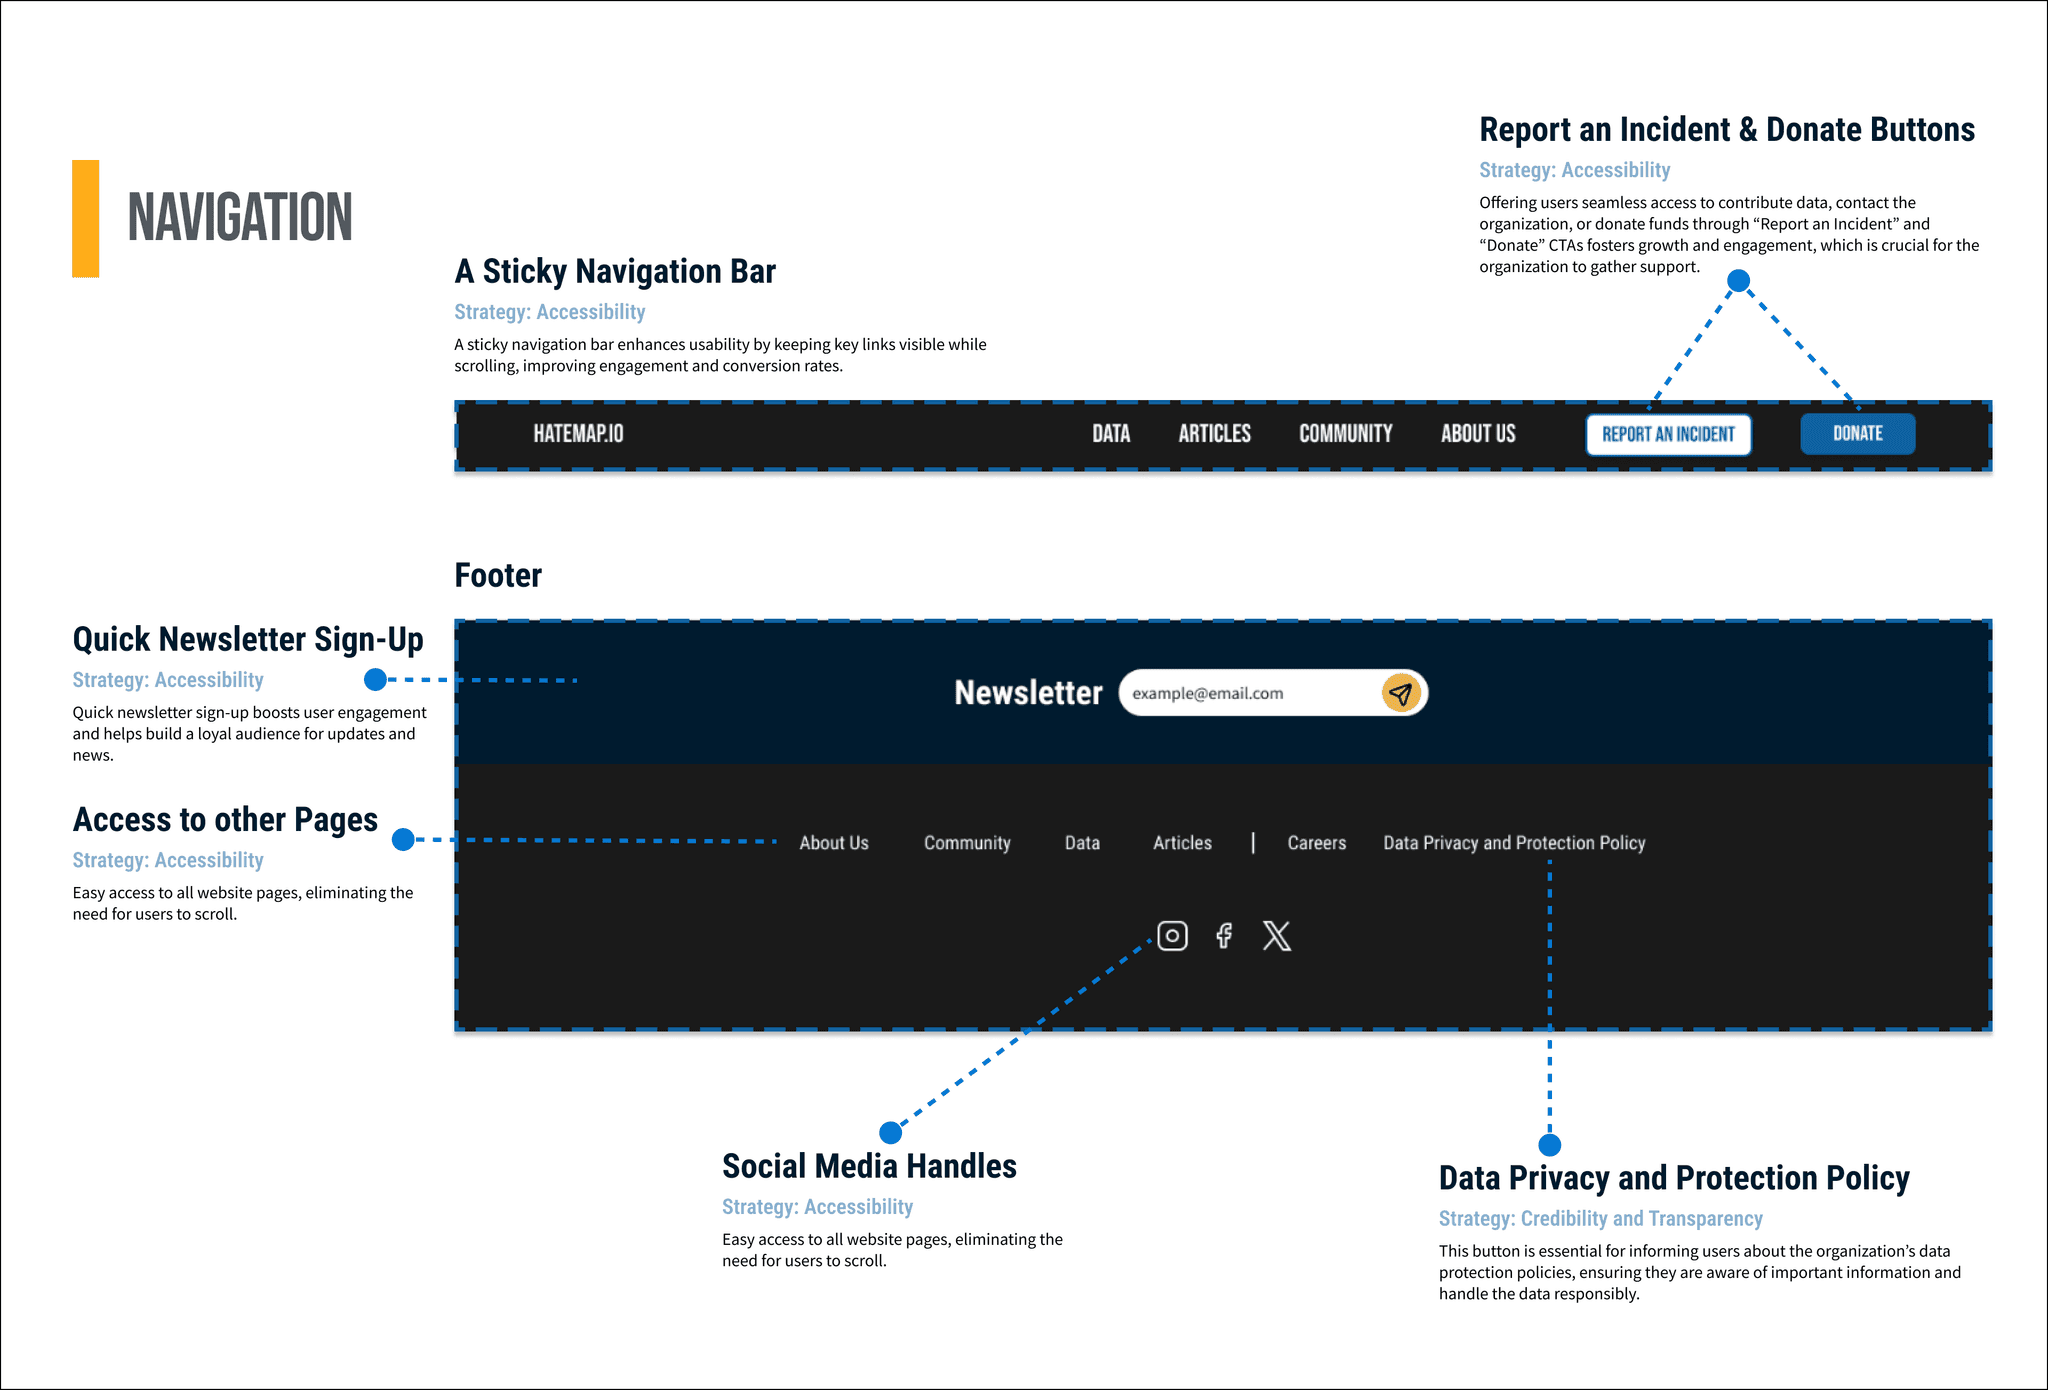
Visual/Structural representation of our design solutions, organised hierarchically.