AuraTura: The smarter way to track your emotional health
AuraTura: The smarter way to track your emotional health
How I created a simple but powerful tool that helps users map their emotions using science-backed journaling. This tool makes invisible feelings visible, so people can understand and improve their emotional health—one day at a time.
#DataVisualisation #UXResearch #EmotionalDesign #PassionProject
Tools
P5.Js, Tableau, Data Wrapper, Javascript, Figma, Google sheets, Google Docs
Tools
P5.Js, Tableau, Data Wrapper, Javascript, Figma, Google sheets, Google Docs
Duration
June 2024 - December 2024
Duration
June 2024 - December 2024
Methodology
Qualitative UX Research: User Interviews, Diary studies, Secondary Research, Participatory Design. Quantitative Research: Surveys, Big 5 personality test. Data Visualisation Methods: Side by side bar graph, Scattered Plot, Radar Graph, Stacked bar chart, Coding with P5.Js & Javascript.
Methodology
Qualitative UX Research: User Interviews, Diary studies, Secondary Research, Participatory Design. Quantitative Research: Surveys, Big 5 personality test. Data Visualisation Methods: Side by side bar graph, Scattered Plot, Radar Graph, Stacked bar chart, Coding with P5.Js & Javascript.
Let's be real—how many of us actually feel confident?
Let's be real—how many of us actually feel confident?
Growing up as the middle child, confidence didn’t come easy to me. It took years—countless self-help books, endless heart-to-heart talks with friends, and their unwavering support—just to start believing in myself.
But as I slowly grew more confident, one question kept nagging at me: "Am I the only one who struggled with confidence?"
So, I decided to find out. I sent a quick survey to people of all ages, from different countries.
58 people responded— and the answers "Absolutely eye-opening."
"Each generation seems to be losing confidence compared to the one before."
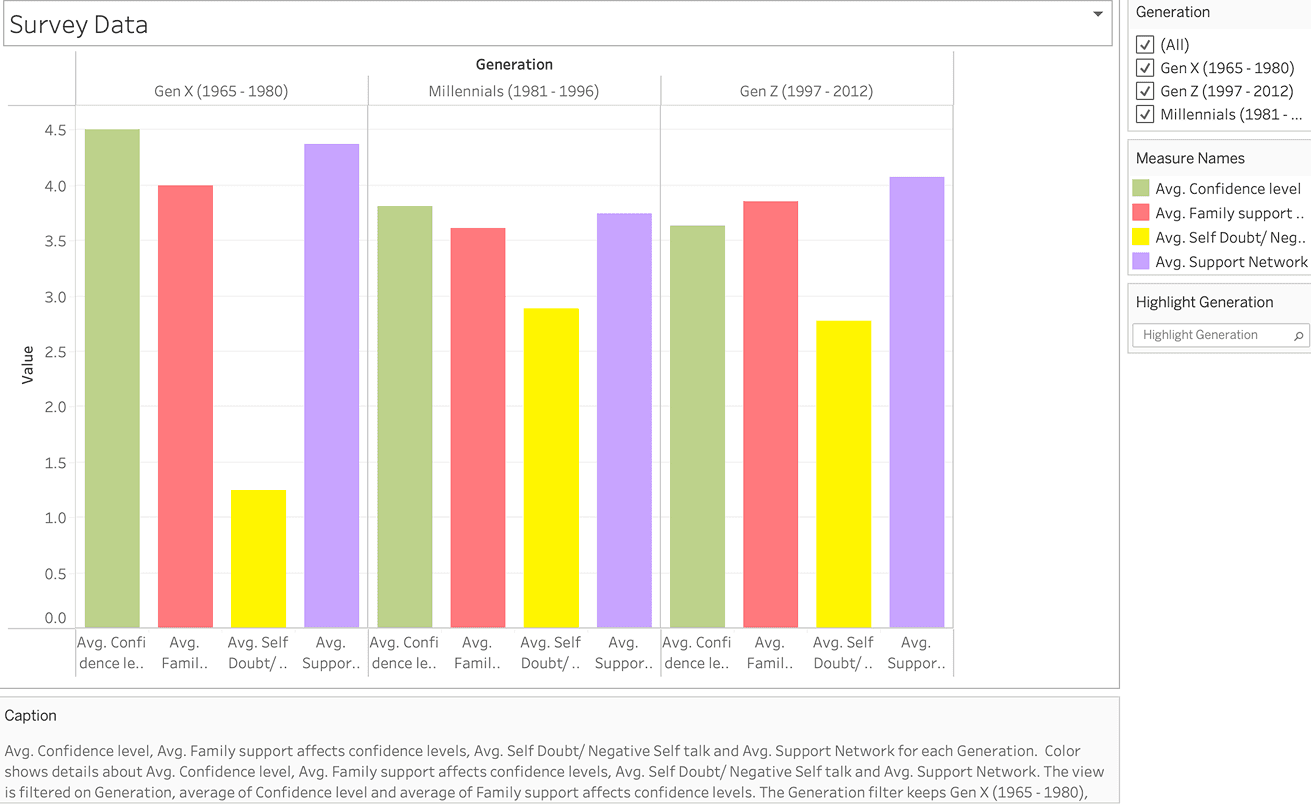
This chart compares data collected from three generations—Gen X, Millennials, and Gen Z—focusing on average ratings (on a scale of 0 to 5) across four key factors:
1. Confidence Levels.
2. Impact of Family Support on Confidence.
3. Effect of Self-Doubt and Negative Self-Talk on Confidence.
4. Contribution of Support Networks to Confidence.
Gen X Leads in Confidence—Here’s Why:
The numbers don’t lie: Gen X tops the chart with a confidence level of 4.5 out of 5. What’s their secret? Strong family ties, reliable social networks, and—crucially—less self-doubt holding them back.
Millennials Trail Behind at 3.8:
Compared to Gen X, Millennials report lower confidence. Why? Higher self-criticism, weaker family reliance, and thinner support systems seem to play a role.
Gen Z Struggles the Most (3.6):
Even with closer family bonds and active social networks, Gen Z still battles nagging self-doubt—just slightly less than Millennials.
The Big Takeaway:
Confidence isn’t just about mindset—it’s shaped by who’s got your back and how you talk to yourself. And right now, younger generations are fighting an uphill battle on both fronts.
But, confidence struggles were just the tip of the iceberg...
But, confidence struggles were just the tip of the iceberg...
Young adults (early 20s to 30s) often face more emotional challenges that leave them feeling overwhelmed. While emotional struggles affect all ages, this group experiences them more intensely due to:
🔹 Big Life Changes – College, new jobs, and moving out on their own bring uncertainty and stress.
🔹 Pressure to Succeed – Expectations to excel in academics and careers can heighten anxiety and self-doubt.
🔹 Relationships & Identity – Friendships, dating, and personal growth all shape emotional well-being, sometimes adding stress.
🔹 Social Media’s Influence – Constant comparison and FOMO (fear of missing out) can lead to feelings of envy, loneliness, or inadequacy.
Recognising these struggles is the first step in creating better support systems to help young adults navigate this crucial stage of life
Why young adults struggle with emotions more intensely
Why young adults struggle with emotions more intensely
We've all been there - that moment when you know you're feeling something but:
Can't put a name to it
Don't know why it's happening
Have no idea if it's getting better or worse
Don't know how to solve it
This frustration led me to my mission:
"How might we create something that acts like a fitness tracker... but for your emotions?"
Imagine a tool that:
Identifies your emotions (like "Anxious" vs "Sad")
Shows patterns (like "Intensity of your sadness every Tuesday afternoon or any other day at any time")
Guides you forward (with small, doable steps to feel better)
Target Users: Young Adults in 20s & 30s.
This isn't about fixing people - it's about giving them the clarity and control we all deserve when it comes to our emotions. Because understanding your feelings shouldn't require a psychology degree.
Building an emotion tracker that actually helps
Building an emotion tracker that actually helps
Turns out, confidence isn’t the only struggle people are facing. Reading through the survey responses, I noticed something deeper—raw, honest quotes that revealed a much bigger picture:
“I want to be more sure about what I’m doing.”
“I don’t feel like I’m enough.”
“I struggle with self-acceptance.”
“I wish I could express myself better—my thoughts, my feelings.”
“I’m exhausted all the time—mentally, emotionally, physically. Rest never feels like enough.”
“Making connections is hard. I’m just… not a ‘social’ person.”
“What if I fail?”
These weren’t just passing comments. They were glimpses into real battles with self-doubt, burnout, loneliness, and fear.
Suddenly, the conversation wasn’t just about confidence levels anymore. It was about everything beneath them—the emotional weight so many of us carry silently.
The Solution: Science-Backed Writing Trick That Unlocks Your Emotions
The Solution: Science-Backed Writing Trick That Unlocks Your Emotions
Scatter Plot Interpretation:
Visual Data Representation
Plots 4 emotional struggles (0-5 scale) vs. resilience levels (0-5) over 6 days
Color-coded by participant
Shape-coded metrics:
★ Negative Self-Talk
● Self-Doubt
■ Procrastination
◆ Imposter Syndrome
Core Findings
All participants experienced at least 3/4 struggles during the week
Resilience levels fluctuated daily (Y-axis variation)
Procrastination & Self-Doubt were most frequent high-scorers
Critical Takeaway
These recurring emotional challenges demand targeted solutions - especially for:
✓ Daily resilience building
✓ Breaking negative thought cycles
✓ Overcoming productivity blockers
Finding 2. Career Performance vs. Personal Struggles: Impact on Confidence and Emotions.
4/5 participants discussed struggles related to their confidence in their careers, while only one person mentioned personal struggles.
Participants in these age groups primarily focused on career perspectives, opening up about personal struggles only during individual interviews, indicating a preference for presenting a strong front and discomfort with vulnerability. This underscores the need for a safe space to freely communicate feelings.
Diary Study: Uncovering deep user insights through longitudinal research
Diary Study: Uncovering deep user insights through longitudinal research
Then I discovered something fascinating - researchers have actually found a written solution to emotional confusion. It's called:
Pennebaker's Journal Method (and it's science-approved)
Here's how this "emotional untangling" works:
1. 15-20 minutes of raw, honest writing
2. Done consistently (like once a week for a month)
3. Structured prompts to guide your self-exploration
The proven benefits will surprise you:
✅ Mental clarity (finally understanding your feelings)
✅ Emotional armor (better handling life's ups/downs)
✅ Bonus physical perks (yes, writing can help your body too!)
This isn't fluffy journaling - it's a research-backed protocol that's helped thousands organise their emotional chaos.

User Interviews
User Interviews
The 'Big five personality test'
The 'Big five personality test'
Next, I gave each participant the gold-standard Big Five Personality Test (Rammstedt & John, 2007), and the Dominant Trait Emerged:
4/5 participants scored high in neuroticism
Common associated challenges:
✓ Heightened anxiety
✓ Frequent mood swings
✓ Chronic worry cycles
✓ Perfectionist tendencies
✓ Self-esteem struggles
The big question hit me: How could I transform this powerful journaling method into something you'd actually use daily and digitally?
I put science to the test with a hands-on experiment:
The 7-Day Journal Challenge
1. Recruited 5 participants to track emotions daily
2. Created guided prompts based on Pennebaker's method
3. Added tool-inspired questions to boost self-awareness
Here's what made it work:
1. Structured Simplicity - No vague "write your feelings," but clear, actionable questions
2. Progress Tracking - Built-in way to compare day-to-day emotional shifts
3. Real-Time Insights - Spot patterns as they emerge, not weeks later
What I learned from five individuals about Emotional Struggles:
Finding 1. Resilience levels differ, but the struggles remain the same
The journal study revealed something fascinating - no matter how mentally strong someone seemed, all the participants battled these 4 universal struggles:
The Frustration Cycle
"Why do I keep hitting the same walls every day?"Self-Attack Mode
"That voice saying 'You should be doing better' never shuts up"Time Anxiety Spiral
"There's never enough time, yet I waste so much of it"Emotional Whiplash
"One minute I'm fine, next minute I'm overwhelmed"
The shocking part? These weren't occasional issues - they were daily battles for every participant.
AuraTura: The smarter way to track your emotional health
AuraTura: The smarter way to track your emotional health
Let's be real—how many of us actually feel confident?
Let's be real—how many of us actually feel confident?
Growing up as the middle child, confidence didn’t come easy to me. It took years—countless self-help books, endless heart-to-heart talks with friends, and their unwavering support—just to start believing in myself.
But as I slowly grew more confident, one question kept nagging at me: "Am I the only one who struggled with confidence?"
So, I decided to find out. I sent a quick survey to people of all ages, from different countries.
58 people responded— and the answers "Absolutely eye-opening."
"Each generation seems to be losing confidence compared to the one before."
This chart compares data collected from three generations—Gen X, Millennials, and Gen Z—focusing on average ratings (on a scale of 0 to 5) across four key factors:
1. Confidence Levels.
2. Impact of Family Support on Confidence.
3. Effect of Self-Doubt and Negative Self-Talk on Confidence.
4. Contribution of Support Networks to Confidence.
Gen X Leads in Confidence—Here’s Why:
The numbers don’t lie: Gen X tops the chart with a confidence level of 4.5 out of 5. What’s their secret? Strong family ties, reliable social networks, and—crucially—less self-doubt holding them back.
Millennials Trail Behind at 3.8:
Compared to Gen X, Millennials report lower confidence. Why? Higher self-criticism, weaker family reliance, and thinner support systems seem to play a role.
Gen Z Struggles the Most (3.6):
Even with closer family bonds and active social networks, Gen Z still battles nagging self-doubt—just slightly less than Millennials.
The Big Takeaway:
Confidence isn’t just about mindset—it’s shaped by who’s got your back and how you talk to yourself. And right now, younger generations are fighting an uphill battle on both fronts.
But, confidence struggles were just the tip of the iceberg...
But, confidence struggles were just the tip of the iceberg...
Turns out, confidence isn’t the only struggle people are facing. Reading through the survey responses, I noticed something deeper—raw, honest quotes that revealed a much bigger picture:
“I want to be more sure about what I’m doing.”
“I don’t feel like I’m enough.”
“I struggle with self-acceptance.”
“I wish I could express myself better—my thoughts, my feelings.”
“I’m exhausted all the time—mentally, emotionally, physically. Rest never feels like enough.”
“Making connections is hard. I’m just… not a ‘social’ person.”
“What if I fail?”
These weren’t just passing comments. They were glimpses into real battles with self-doubt, burnout, loneliness, and fear.
Suddenly, the conversation wasn’t just about confidence levels anymore. It was about everything beneath them—the emotional weight so many of us carry silently.
Why young adults struggle with emotions more intensely
Why young adults struggle with emotions more intensely
Young adults (early 20s to 30s) often face more emotional challenges that leave them feeling overwhelmed. While emotional struggles affect all ages, this group experiences them more intensely due to:
🔹 Big Life Changes – College, new jobs, and moving out on their own bring uncertainty and stress.
🔹 Pressure to Succeed – Expectations to excel in academics and careers can heighten anxiety and self-doubt.
🔹 Relationships & Identity – Friendships, dating, and personal growth all shape emotional well-being, sometimes adding stress.
🔹 Social Media’s Influence – Constant comparison and FOMO (fear of missing out) can lead to feelings of envy, loneliness, or inadequacy.
Recognising these struggles is the first step in creating better support systems to help young adults navigate this crucial stage of life
Building an emotion tracker that actually helps
Building an emotion tracker that actually helps
We've all been there - that moment when you know you're feeling something but:
Can't put a name to it
Don't know why it's happening
Have no idea if it's getting better or worse
Don't know how to solve it
This frustration led me to my mission:
"How might we create something that acts like a fitness tracker... but for your emotions?"
Imagine a tool that:
Identifies your emotions (like "Anxious" vs "Sad")
Shows patterns (like "Intensity of your sadness every Tuesday afternoon or any other day at any time")
Guides you forward (with small, doable steps to feel better)
Target Users: Young Adults in 20s & 30s.
This isn't about fixing people - it's about giving them the clarity and control we all deserve when it comes to our emotions. Because understanding your feelings shouldn't require a psychology degree.
The Solution: Science-Backed Writing Trick That Unlocks Your Emotions
The Solution: Science-Backed Writing Trick That Unlocks Your Emotions
Then I discovered something fascinating - researchers have actually found a written solution to emotional confusion. It's called:
Pennebaker's Journal Method (and it's science-approved)
Here's how this "emotional untangling" works:
1. 15-20 minutes of raw, honest writing
2. Done consistently (like once a week for a month)
3. Structured prompts to guide your self-exploration
The proven benefits will surprise you:
✅ Mental clarity (finally understanding your feelings)
✅ Emotional armor (better handling life's ups/downs)
✅ Bonus physical perks (yes, writing can help your body too!)
This isn't fluffy journaling - it's a research-backed protocol that's helped thousands organise their emotional chaos.
Diary Study: Uncovering deep user insights through longitudinal research
Diary Study: Uncovering deep user insights through longitudinal research
The big question hit me: How could I transform this powerful journaling method into something you'd actually use daily and digitally?
I put science to the test with a hands-on experiment:
The 7-Day Journal Challenge
1. Recruited 5 participants to track emotions daily
2. Created guided prompts based on Pennebaker's method
3. Added tool-inspired questions to boost self-awareness
Here's what made it work:
1. Structured Simplicity - No vague "write your feelings," but clear, actionable questions
2. Progress Tracking - Built-in way to compare day-to-day emotional shifts
3. Real-Time Insights - Spot patterns as they emerge, not weeks later
What I learned from five individuals about Emotional Struggles:
Finding 1. Resilience levels differ, but the struggles remain the same
The journal study revealed something fascinating - no matter how mentally strong someone seemed, all the participants battled these 4 universal struggles:
The Frustration Cycle
"Why do I keep hitting the same walls every day?"Self-Attack Mode
"That voice saying 'You should be doing better' never shuts up"Time Anxiety Spiral
"There's never enough time, yet I waste so much of it"Emotional Whiplash
"One minute I'm fine, next minute I'm overwhelmed"
The shocking part? These weren't occasional issues - they were daily battles for every participant.
Scatter Plot Interpretation:
Visual Data Representation
Plots 4 emotional struggles (0-5 scale) vs. resilience levels (0-5) over 6 days
Color-coded by participant
Shape-coded metrics:
★ Negative Self-Talk
● Self-Doubt
■ Procrastination
◆ Imposter Syndrome
Core Findings
All participants experienced at least 3/4 struggles during the week
Resilience levels fluctuated daily (Y-axis variation)
Procrastination & Self-Doubt were most frequent high-scorers
Critical Takeaway
These recurring emotional challenges demand targeted solutions - especially for:
✓ Daily resilience building
✓ Breaking negative thought cycles
✓ Overcoming productivity blockers
Finding 2. Career Performance vs. Personal Struggles: Impact on Confidence and Emotions.
4/5 participants discussed struggles related to their confidence in their careers, while only one person mentioned personal struggles.
Participants in these age groups primarily focused on career perspectives, opening up about personal struggles only during individual interviews, indicating a preference for presenting a strong front and discomfort with vulnerability. This underscores the need for a safe space to freely communicate feelings.
The 'Big five personality test'
The 'Big five personality test'
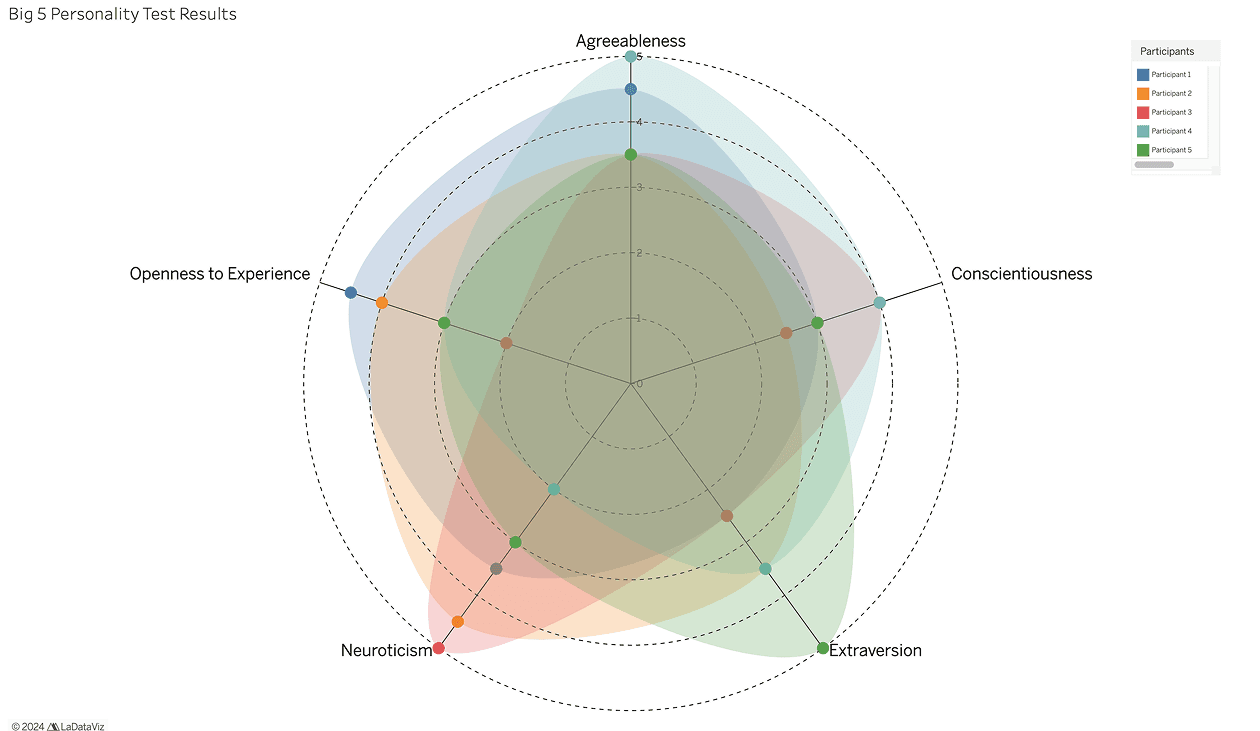
Next, I gave each participant the gold-standard Big Five Personality Test (Rammstedt & John, 2007), and the Dominant Trait Emerged:
4/5 participants scored high in neuroticism
Common associated challenges:
✓ Heightened anxiety
✓ Frequent mood swings
✓ Chronic worry cycles
✓ Perfectionist tendencies
✓ Self-esteem struggles
Radar Graph Interpretation:
Visual Data Representation:
Color-coded participants for clear comparison
Circle size/position indicates trait intensity
Critical Implication:
Solutions must specifically address neuroticism-related:Emotional volatility
Negative thought patterns
Fear of failure
From Research to reality: How I designed the emotion mapping feature for AuraTura
From Research to reality: How I designed the emotion mapping feature for AuraTura
User Interviews
User Interviews
Then, I sat down with each participant for raw, revealing interviews right after their journaling week. Here's why these 45-minute deep dives mattered:
Heard their uncensored stories - The emotional whiplash no survey could capture.
Discovered hidden patterns - Like why certain days triggered more self-doubt.
Learned what actually helps - Their personal coping mechanisms that worked.
Key Insights from User Interviews
1. Interview Approach & Participant Mix
Conducted 30-45 min moderated interviews for deep insights
Included 2 journal study participants (P1 & P3) + 3 new participants (P6-P8)
Cross-referenced journals vs. verbal responses for richer data
2. Standout Findings from Returning Participants
Participant 1:
Confidence struggles:
✓ Social comparison ("I measure success by others' wins")
✓ Self-imposed pressure ("My standards are never met")
✓ Language barriers ("My English fluency holds me back")
Participant 3:
Open about body image’s impact on perception
Added depth to journal insights in conversation
3. New Participants’ Perspectives
All tied confidence to career growth
Easier to discuss work struggles than personal doubts
Common themes:
P8 (Male, 30): Avoided work due to appearance-based shame
P7 (Female, 31): Needed external validation (certificates, praise)
P6 (Female, 26): Lifelong adequacy struggles (middle child dynamic)
4. Universal Struggles
Self-doubt ("Am I really good enough?")
Harsh self-criticism ("I should be doing better")
Desire for self-improvement ("I just want to feel secure")
Key Research Insight:
Before users can take action on their emotions, they need to first see them clearly. Just like fog lifts to reveal the road ahead, people need to:
Spot Their Patterns - Recognise how their emotions fluctuate daily
Understand Intensity - See which feelings hit them hardest
Connect the Dots - Notice what triggers certain emotions
Only then can they create an effective plan to manage their emotional wellbeing. That's why emotional mapping starts with making emotions visible through journal tracking - it clears the "emotional fog" so users can navigate forward with confidence.
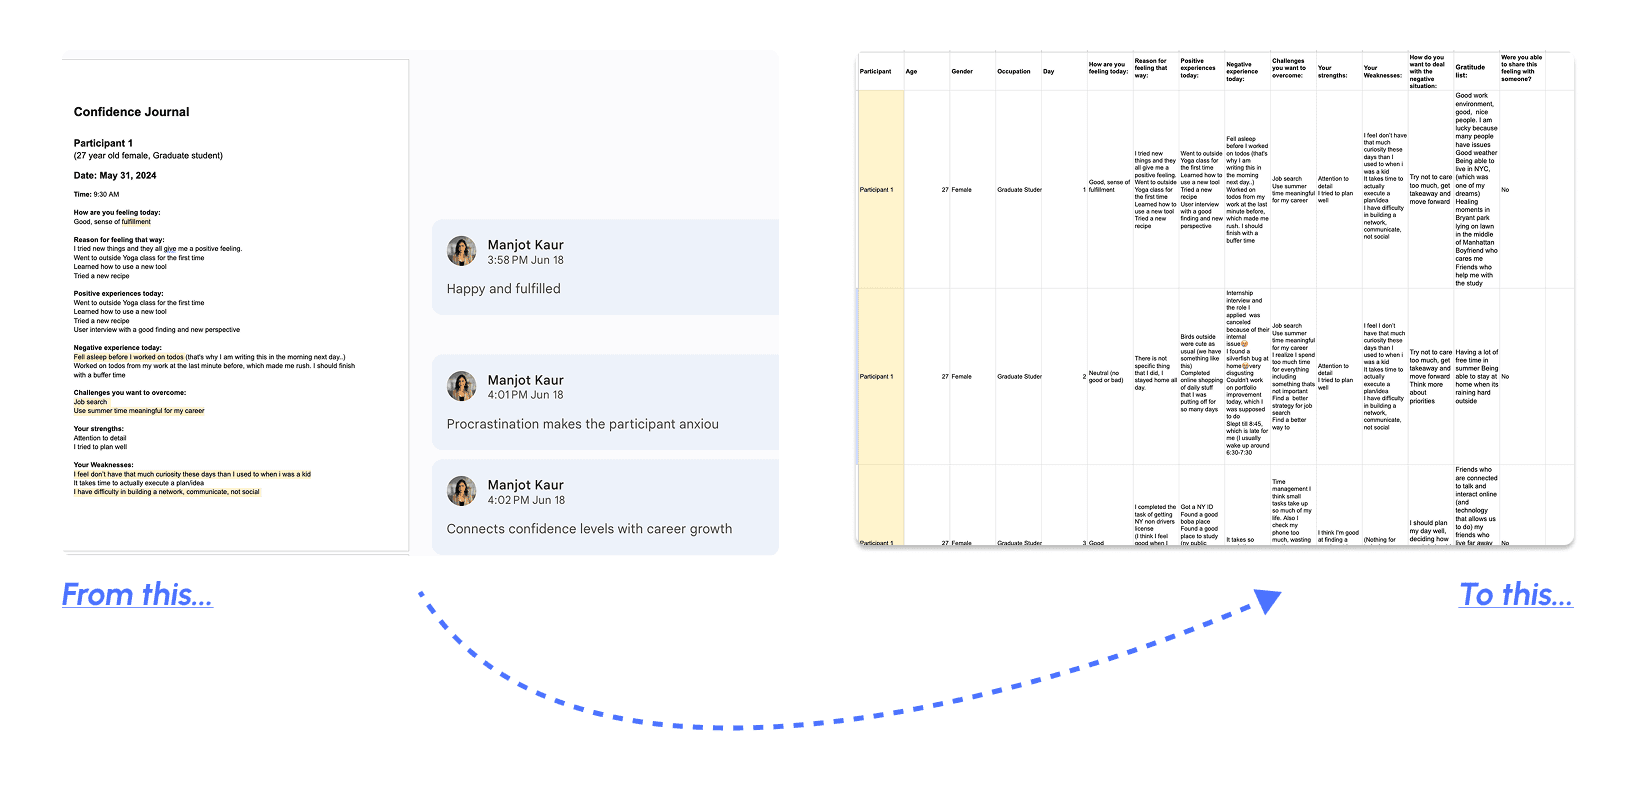
Take a look at the actual data from the testers below:
Analysing emotional patterns for each participant:
Step 1: Turning Journal Entries into Emotion Data
Users Write Freely
They journal about their day and express their feelings naturally.
Spotting the Emotions
The app scans each entry for words linked to 5 core emotions:
- Joy
- Sadness
- Anger
- Fear
- Disgust
(Plus anxiety as an extra key emotion)
Counting Emotional Moments
Every time a user mentions one of these emotions (or related words), it gets logged.
Example: If someone writes, “I felt so angry when my friend canceled plans, but also happy about my promotion,” the app counts:
Anger: 1
Joy: 1
Calculating Daily Intensity
The more an emotion comes up in a day, the “stronger” it’s rated.
Example data from real testers:
Participant A: Mentioned “anxious” 3 times → High anxiety day
Participant B: Used “joy” words 5 times → Very happy day
This process turns messy feelings into clear patterns, so users can see their emotions—not just feel them.
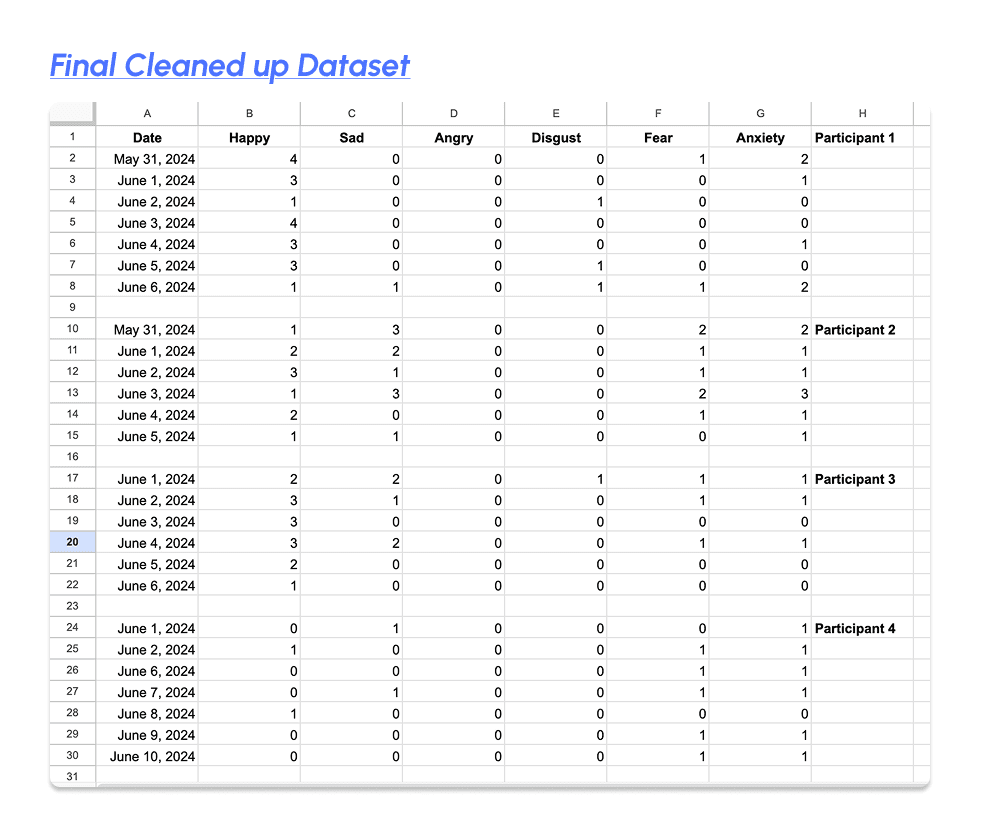
I categorised their experiences into six core emotions: Happy, Sad, Angry, Fear, Disgust, and Anxiety as mentioned in Step 1 (inspired by Disney's Inside Out).
This classification was based on how participants reported feeling each day and the frequency with which they expressed these emotions in their daily writings.
Making the Data Visualisations Clearer
To create meaningful emotion graphs, I needed to adjust my approach. Here's why:
The Zero-Value Problem
The original data had lots of "zero" emotion days
This made the graphs look flat and unhelpful
The Solution
Created sample data that showed all possible emotions
This let us design visualisations that clearly display:
How often each emotion appears
How strong different feelings are
The Sample Dataset

From Research to reality: How I designed the emotion mapping feature for AuraTura
From Research to reality: How I designed the emotion mapping feature for AuraTura
Key Research Insight:
Before users can take action on their emotions, they need to first see them clearly. Just like fog lifts to reveal the road ahead, people need to:
Spot Their Patterns - Recognise how their emotions fluctuate daily
Understand Intensity - See which feelings hit them hardest
Connect the Dots - Notice what triggers certain emotions
Only then can they create an effective plan to manage their emotional wellbeing. That's why emotional mapping starts with making emotions visible through journal tracking - it clears the "emotional fog" so users can navigate forward with confidence.
Step 1: Turning Journal Entries into Emotion Data
Users Write Freely
They journal about their day and express their feelings naturally.
Spotting the Emotions
The app scans each entry for words linked to 5 core emotions:
- Joy
- Sadness
- Anger
- Fear
- Disgust
(Plus anxiety as an extra key emotion)
Counting Emotional Moments
Every time a user mentions one of these emotions (or related words), it gets logged.
Example: If someone writes, “I felt so angry when my friend canceled plans, but also happy about my promotion,” the app counts:
Anger: 1
Joy: 1
Calculating Daily Intensity
The more an emotion comes up in a day, the “stronger” it’s rated.
Example data from real testers:
Participant A: Mentioned “anxious” 3 times → High anxiety day
Participant B: Used “joy” words 5 times → Very happy day
This process turns messy feelings into clear patterns, so users can see their emotions—not just feel them.
Take a look at the actual data from the testers below:
Analysing emotional patterns for each participant:
I categorised their experiences into six core emotions: Happy, Sad, Angry, Fear, Disgust, and Anxiety as mentioned in Step 1 (inspired by Disney's Inside Out).
This classification was based on how participants reported feeling each day and the frequency with which they expressed these emotions in their daily writings.
Making the Data Visualisations Clearer
To create meaningful emotion graphs, I needed to adjust my approach. Here's why:
The Zero-Value Problem
The original data had lots of "zero" emotion days
This made the graphs look flat and unhelpful
The Solution
Created sample data that showed all possible emotions
This let us design visualisations that clearly display:
How often each emotion appears
How strong different feelings are
The Sample Dataset
Step 2. I began experimenting with P5.js to create dynamic visualisations, integrating the sample dataset to bring the data to life in new and exciting ways.
Emotion Bubbles: This vibrant snapshot turns your emotional whirlwind into something you can actually see:

Color-Coded Feelings:
Yellow = Happiness
Red = Anger
Purple = Fear
Orange = Anxiety
Green = Disgust
Size Matters:
The bigger the bubble, the stronger that emotion hit you that day.
Interactive Insight:
Click any bubble to reveal:
Exactly how intense that feeling was.
Which specific day it spiked.
The Catch?
While this visual explosion perfectly mirrors your mental chaos, it's like looking at a storm through a kaleidoscope—beautiful but not actionable.
That's why I evolved to a more structured approach—one that doesn't just show your emotions, but helps you master them.
Emotion Journey Map: This visualisation highlights the journey of your emotions throughout the week.

The size of each circle grows as the intensity of the emotion increases.
The Y-Axis represents the intensity of emotions, measured on a scale from 1 to 5.
The X-Axis displays the days of the week.

Tap on an emotion to explore when you experienced it and its intensity.
The lines illustrate the progression of each emotion from one day to the next.
Why this visualisation works?
1. Smart Emotion Tracking
The system analyzes your journal entries for emotional keywords
Detects how often you mention happiness, anger, fear, etc.
Measures intensity based on repetition and context
2. Your Emotional Week at a Glance
Colors = Different emotions (e.g., yellow = joy, red = anger).
Bubble size = How strong that feeling was that day.
Day-by-day breakdown = Spot trends (e.g., "I’m always anxious on Mondays")
3. Actionable Self-Discovery
✅ Clarity – "Oh, I didn’t realise I felt anger this often!"
✅ Patterns – "My anxiety peaks midweek—why?"
✅ Focus – Helps you tackle one emotion at a time.
4. Small Steps, Big Change
No more guessing—see your emotions evolve.
Turns vague feelings into clear, trackable data.
Encourages tiny, manageable improvements (e.g., "Today, I’ll reduce my stress triggers")
The Best Part?
This emotion mapping feature for the app transforms your thoughts into a roadmap—helping you understand, reflect, and grow one journal entry at a time.
Key Lessons & Excitement for AuraTura
Key Lessons & Excitement for AuraTura
Key Lessons & Excitement for AuraTura
Why This Matters to Me (And Everyone Else)
My Struggle with Emotions: Like many people, I used to find emotions confusing and hard to track—which inspired me to build this tool.
The Emotional Fog: Self-doubt and uncertainty make it hard for people to understand their feelings. Emotion Mapping helps clear that fog.
Key Lessons from This Journey
Tech Meets Emotion: Learned to code emotion-tracking features (JavaScript + data) to turn abstract feelings into clear patterns.
Research Revelations: Discovered that everyone—even emotionally stable people—faces moments of doubt, proving we all need better tools.
Real-World Impact: Saw how many struggle daily with emotions, reinforcing why building an app like this matters.
Beyond Journaling: The Next Steps
Science-Backed, Action-Oriented:
Journaling (based on Pennebaker’s research) is powerful—but I’m going further.
New features will help users turn emotional insights into actionable steps, so they can make measurable progress.
Smarter Tracking: Adding tools to predict patterns, suggest coping strategies, and celebrate growth.
The Bigger Vision
A Revolutionary Approach: AuraTura isn’t just another tracker—it’s a way to reshape how people understand and manage emotions.
Just the Beginning: I’m thrilled to keep iterating, testing, and building. The best is yet to come!